
The BER adapts standard expenditure review tools to encompass a wide range of actors beyond the public sector. The entire BER process is typically structured into five steps: Prepare, Define Main Parameters, Collect Data, Analyze Data, and Project Future Expenditures.
4.1 Concepts and objectives of a BER
The BER builds on extensive experience of public expenditure reviews across many policy areas. It focuses on a range of key natural resource sectors — forestry, fisheries, agriculture, mining, water and others prioritized in the PIR — and supports the CBD financial reporting agenda. Expenditure reviews must be grounded in a background of macroeconomic and fiscal information in each country. The BER should use measures such as Gross Domestic Product (GDP), real GDP growth and inflation, sectoral jobs and sector contributions to GDP, and government budgets as a per cent of GDP, among others, as inputs.
Definition
A biodiversity expenditure is defined as any expenditure whose purpose is to have a positive impact or to reduce or eliminate pressures on biodiversity. This includes both direct/primary expenditures (where biodiversity is the principal purpose) and indirect/secondary expenditures (where biodiversity is a secondary, clearly identified objective).
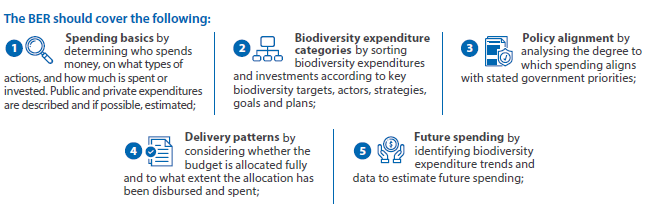
The BER findings are critical inputs for the Financial Needs Assessment, establishing a reference point against which financial needs are compared, and for identifying, prioritizing, and implementing finance solutions in the Biodiversity Finance Plan.
4.2 Summary of the five steps of a BER
Step 1 — Prepare
Preparation involves defining the scope of the analysis (including the years covered and organizations involved), identifying key stakeholders, and establishing a data management system. The BER data should ideally cover at least the previous five years for which complete data is available. It is crucial to engage the key decision-makers (identified as the “client” of the BER) early in the process to ensure the analysis meets their needs.
Step 2 — Define the main parameters of the BER
The aim of this step is to establish a process that can be repeated periodically to give results that are replicable and consistent. The BER process and attribution approach can ultimately be used to assist with the development of biodiversity tracking in budgets and expenditures. The tracking or tagging of biodiversity expenditures offers one valuable long-term outcome of the BIOFIN process for countries as they can consistently record and track the amount of money that is being spent on biodiversity over time. The Global Biodiversity Expenditure (GLOBE) Taxonomy and its guidance document introduce a comprehensive list of biodiversity expenditures aligned with the GBF targets, providing standard definitions and Biodiversity Attribution Rates (BARs).
Clarify biodiversity expenditures
Identify how to distinguish biodiversity expenditures from general environmental expenditures. The GLOBE Guidance can provide definitions.
Classification and tagging system
BIOFIN classifies biodiversity expenditures into nine primary Biodiversity Categories and associated subcategories. The team must also decide on relevant national (e.g. NBSAP) and international (e.g. GBF, SDGs) goals the expenditures should be classified and mapped towards.
Attribution of primary and secondary expenditures
Establish the attribution system. Primary expenditures are typically assigned 100%. Secondary expenditures are assigned a Biodiversity Attribution Rate (BAR) of 1, 5, 25, 50 or 75%. The analysis can use a detailed programme approach (best practice) or a broader agency approach.
Step 3 — Collect data
Data, including budgets, allocations, and expenditures, are collected from public institutions, the private sector, and civil society organizations. Data sources include line ministries, national statistics offices, central banks, annual reports, and donor databases. To ensure consistency and comparability, macroeconomic indicators (GDP, inflation, exchange rates) are collected. Crucially, double counting risk must be managed, typically by adhering to the “abatement or execution principle,” where expenditure is recorded at the implementing agency level.
Step 4 — Analyze data
Data is analysed to estimate biodiversity spending and situate it within the national context.
- Estimate spending (Step 4a): The attribution rate is applied to budgets to estimate the biodiversity expenditure for each agency.
- Analyze spending in national context (Step 4b): Biodiversity spending is compared to macroeconomic indicators (GDP, total public expenditures) and partitioned across ministries, sectors, and the nine BIOFIN Categories to assess trends and priorities.
- Identify relationships (Step 4c): This evaluates the relationship between budgets, allocation, and expenditures to determine fiscal effectiveness and identify constraints, such as delayed transfers or poor absorptive capacity of executing agencies.
The presentation of results may begin with a simple graph showing the evolution of GDP, the total government budget (and expenditure), and inflation. The GDP and government budgets, as well as most of the BER results, can be presented in both nominal and real terms. Graphs and tables should also present the per cent of biodiversity expenditures relative to the budgets of line ministries and sector-based GDP.
The two main trends described are biodiversity expenditure as a share of total government spending and as a share of the budget of the environmental ministry. These patterns are useful to project future biodiversity expenditures, under the assumption that these trends are likely to continue without the implementation of a strong biodiversity finance strategy.
Step 5 — Project future expenditures
This final step projects future biodiversity expenditures over a 5- to 10-year period based on historical trends, macroeconomic assumptions, and potential scenarios. Projection methods often rely on linear regression analysis or moving averages, and sensitivity analysis is recommended to test variable assumptions.
4.3 Biodiversity Expenditure Review in the private sector
The BER recognizes the increasing and critical role of the private sector (including businesses and financial institutions) as agents of biodiversity loss or conservation, given that many are highly dependent on nature.
Collecting this data is challenging due to patchy and unharmonized reporting, but improved disclosure frameworks (such as those related to the Taskforce for Nature-related Financial Disclosures, TNFD) are creating new opportunities. Private sector financing flows include:
- Corporate Social Responsibility (CSR) and philanthropy (donations/grants).
- Green financial products (debt and equity instruments like green bonds and green loans).
- Biodiversity offsets and credits.
- Natural infrastructure investments.
- Sustainable supply chains and Nature-based Solutions (NbS).
Four classifications for private sector flows
For private sector flows, four classifications are used to estimate biodiversity expenditure, acknowledging the dual focus on financial returns and biodiversity intent:
| Type | Motivation | Treatment |
|---|---|---|
| Type 1 | Altruistic motivation. Enhancement of biodiversity is the main focus (e.g. philanthropy/CSR). | The GLOBE Taxonomy can be used as a reference for alignment to public sector financing. The total amount can be added to public sector spending. |
| Type 2 | Financial returns. Maintenance/improvement of financial returns by including biodiversity in the investment portfolio (e.g. green bonds). | The amount is estimated but denoted as a proxy. |
| Type 3 | Climate and biodiversity co-benefits. Financial returns by addressing climate and biodiversity co-benefits (e.g. carbon offsets). | Monitoring is done, but aggregation with public spending is avoided. |
| Type 4 | Compensation. Financial returns by providing compensation for biodiversity loss or damage (e.g. biodiversity offsets). | Monitoring of investments, but no aggregation of estimates with public spending. |
4.4 Reporting and outreach
The BER results are compiled into a comprehensive report, complemented by policy briefs and key messages for advocacy and communication. The results also inform the identification of potential finance solutions for early implementation, focusing on opportunities to increase resources, improve efficiencies, realign spending, or develop cross-cutting enabling solutions. These early solutions are screened based on feasibility, budget availability, and ability to achieve results within one year.