Annex I: Examples of BER Results from Namibia and Philippines

BER in Namibia
The Namibian Ministry of Environment and Tourism (MET) collected expenditure data from 2006 to 2012 and budget data from 2012 to 2015. The MET then created three future expenditure scenarios for their medium-term planning framework, covering 2015-2020, as shown in Figure 4.7. Biodiversity expenditures by ministry over the 15-year period starting 2006/2007 indicate an expected decreasing future trend, as shown in Figure 4.8. The relative share of the Ministry of Agriculture, Water and forests has grown significantly, and to a lesser extent this is also the case for the Ministry of Environment and Tourism.
Figure 4.7: Namibian Government Biodiversity Expenditure Review Ministry of Environment and Tourism (MET) Biodiversity Expenditure Projections: 2006/07 – 2012/13
.png)
Figure 4.8: Namibian Government, Biodiversity Expenditure Review, Real Govt. Biodiversity Expenditure & Projections – 2006/07-2020/21 (N$, Millions, 2013 prices)


BER in Fiji
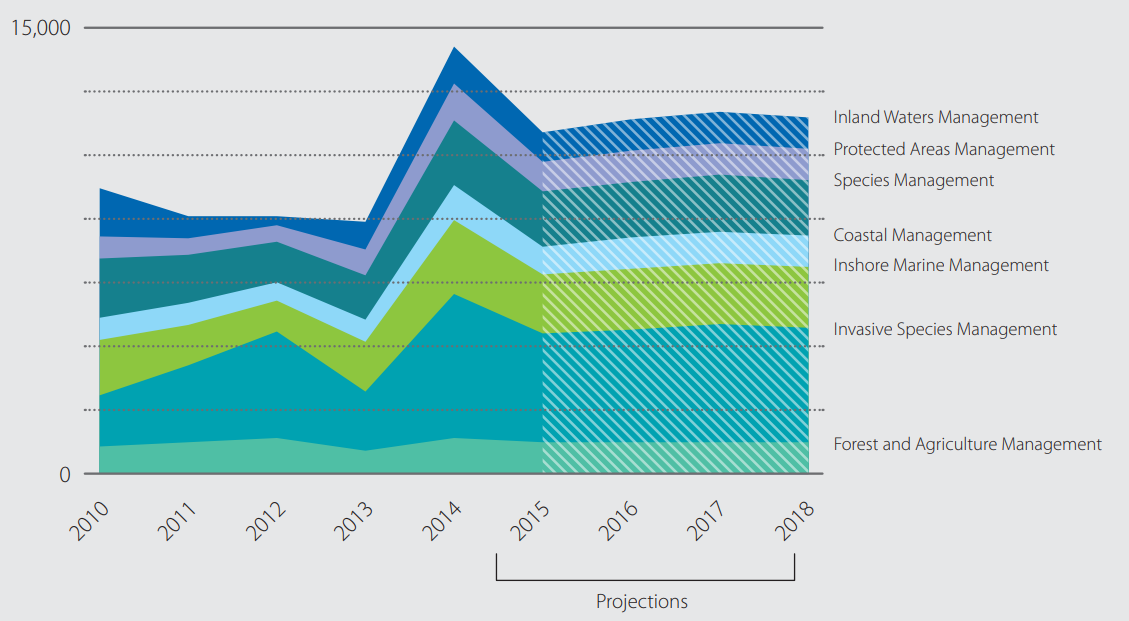
BIOFIN Fiji used a time-series forecasting method to predict biodiversity expenditure levels under a Business-As-Usual scenario.
Figure 4.9: Historic Data and Future Predictions of Expenditure (in Thousands of Fiji Dollars, Nominal) for Biodiversity in Fiji

BER Results from the Philippines
Figure 4.10 and 4.11 show how BIOFIN Philippines disaggregated their BER data. Figure 4.9 indicates the high importance of the Department of Environment and Natural Resources in the implementation of biodiversity programmes in the Philippines. Figure 4.10 illustrates how the country’s coastal areas are the main spending priority, followed by wetlands and agrobiodiversity. The share of protected areas stands only at 10 percent of the total.
Figure 4.10: Philippines – Disaggregation of Expenditures According to Sources of Funds

Figure 4.11: Philippines – Disaggregation of Spending According to Sources of the National Biodiversity Action Plan, Per Thematic Sector
